BALTIMORE (Stockpickr) -- There's no question about it: Some of the biggest price action comes from the lowest-priced stocks.
>>5 Stocks Setting Up to Break Out
From a psychological standpoint, there's something magnetic about low-priced names. That's the only explanation for the elevated trading volumes in the under-$10 stocks.
Just so we're clear, a low share price doesn't necessarily mean that we're talking about a small company, or even a "cheap" one by valuation standards. In fact, by itself, share price isn't a very useful metric at all. But it's true that lower-priced names tend to trade more actively than pricier stocks of similar market capitalization. And when stocks under $10 start making moves, the gains can be substantial on a percentage basis.
>>Buy These 5 Rocket Stocks to Beat the Market
Since the beginning of the month, low-priced stocks are starting to see favor in the broad market again as investors crank up their risk tolerances. That means that we're seeing some actionable technical setups pop up again in this corner of the market. Today, we'll take a closer look at five of them.
For the unfamiliar, technical analysis is a way for investors to quantify qualitative factors, such as investor psychology, based on a stock's price action and trends. Once the domain of cloistered trading teams on Wall Street, technicals can help top traders make consistently profitable trades and can aid fundamental investors in better planning their stock execution.
>>5 Blue-Chip Stocks to Trade for Gains
Without further ado, let's take a look at five technical setups worth trading now.
Nokia
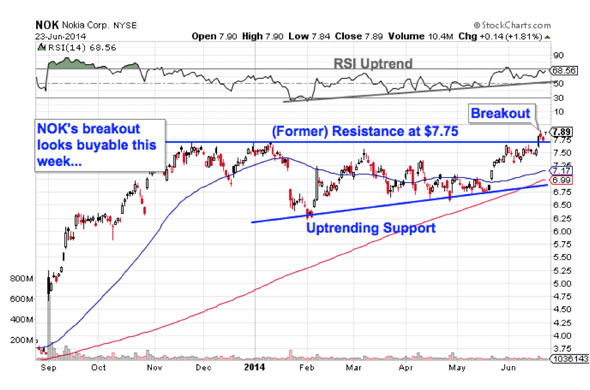
First up is handset maker Nokia (NOK), a good example of a low-priced stock that's not small by any means. This firm may tip the scales with a $29 billion market capitalization, but it trades for under $8 right now. That single-digit price tag might not last long in NOK, however: this stock is breaking out of a long-term bullish setup this week.
>>3 Big Tech Stocks to Trade (or Not)
Nokia spent the last six months forming an ascending triangle pattern, a price setup that's formed by a horizontal resistance level above shares (in this case at $7.75) and uptrending support to the downside. Basically, as NOK has bounced its way between those two technically important price levels, it's been getting squeezed closer and closer to a breakout above that $7.75 price ceiling. When that happened four sessions ago, we got our buy signal in NOK.
Momentum, measured by 14-day RSI, is the confirming indicator to look at in this stock. Our momentum gauge has been making higher lows over the course of the setup. Since momentum is a leading indicator of price, it adds some confidence to this breakout in NOK. If you decide to buy here, keep a protective stop in place at the 200-day moving average.
AK Steel Holding
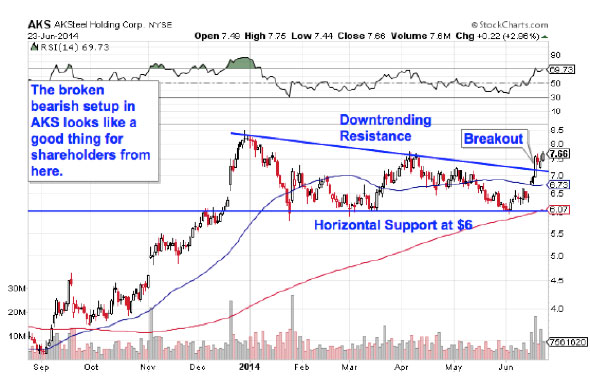
We're seeing another triangle pattern in play in shares of AK Steel Holding (AKS), albeit with some pretty big differences. AKS spent all of 2014 forming a descending triangle, the bearish opposite of the ascending triangle trade that NOK just triggered. Basically, the descending triangle in AKS was waving a red flag that shares looked likely to break down, but the sell signal never triggered.
Best Communications Equipment Stocks To Buy For 2015
>>4 Stocks Rising on Unusual Volume
In fact, shares broke out through the top of the channel within the last week, aborting the descending triangle setup before it had a chance to play out. That's a reprieve for shareholders in AKS, and it's also a bullish signal for traders who haven't looked at this small-cap steel producer yet.
An aborted bearish pattern is every bit as attractive as an outright bullish one, and that makes AKS buyable this week. There's still a stumbling block up at $8.50, the resistance level that started the pattern back in January. But that price ceiling is far enough away from here that there's still plenty of upside potential in AKS right now. Just keep a tight stop in place.
PMC-Sierra
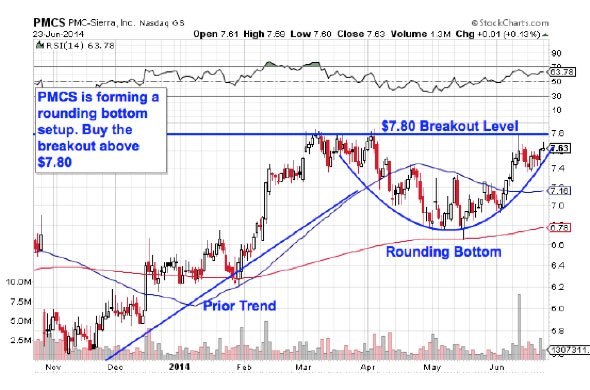
Small-cap tech stock PMC-Sierra (PMCS) has enjoyed a solid run in 2014, rallying close to 19% since the calendar flipped over to January. But PMCS could be in store for even more upside if we see its bullish price pattern trigger this week.
>>5 Stocks With Big Insider Buying
PMC-Sierra is currently forming a "rounding bottom" pattern, a price setup that indicates a gradual transition in control from sellers to buyers. The pattern's name is a pretty good description of how it looks on a chart. Even though PMCS' rounding bottom is forming at the top of its recent price range (not the bottom), the trading implications are just the same. The buy signal triggers on a move through our $7.80 price ceiling.
Why all the significance at $7.80? It all comes down to buyers and sellers. Price patterns are a good quick way to identify what's going on in the price action, but they're not the reason a stock is tradable. Instead, the "why" comes down to basic supply and demand for PMC-Sierra's stock.
The $7.80 resistance level is a price where there has been an excess of supply of shares; in other words, it's a spot where sellers have previously been more eager to step in and take gains than buyers have been to buy. That's what makes a breakout above $7.80 so significant -- the move means that buyers are finally strong enough to absorb all of the excess supply above that price level. Wait for that breakout before you buy.
SandRidge Energy
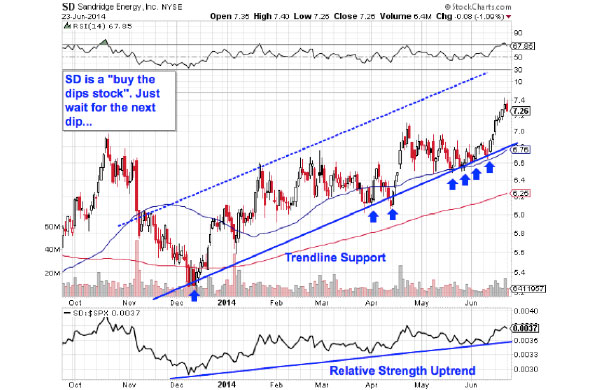
You don't need to be an expert technical trader to figure out why shares of mid-cap oil and gas firm SandRidge Energy (SD) looks bullish right now -- a quick glance at the chart should tell you just about everything you need to know. SD has been a "buy the dips stock" since the middle of December, and now, traders just need to wait for the next dip.
>>A Small-Cap Stocks With Big Upside Potential.
Waiting for a bounce off of trend line support is a key risk management strategy for SD buyers for two big reasons: it's the spot where shares have the furthest to move up before they hit resistance, and it's also the spot where the risk is the least (because shares have the least room to move lower before you know you're wrong). Remember, all trend lines do eventually break, but by actually waiting for the bounce to happen first, you're ensuring SandRidge can actually still catch a bid along that line before you put your money on shares.
SD is exhibiting some outstanding relative strength right now, an indication that shares are outperforming the broad market as we head into the second half of 2014. As long as that uptrend in relative strength stays intact, SD should keep outperforming the S&P 500.
J.C. Penney
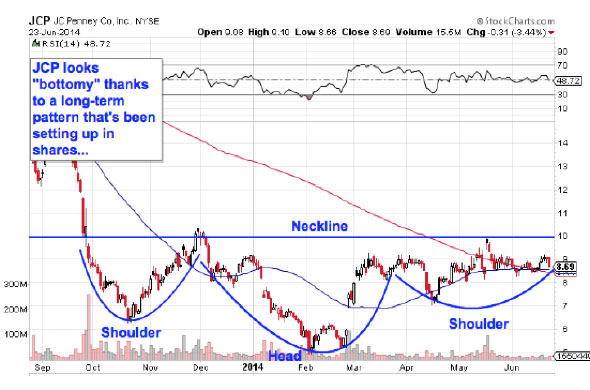
A year ago, department store retailer J.C. Penney (JCP) wouldn't have made this list. That's because 12 months ago and 45% higher, JCP was a double-digit stock. But long-suffering JCP shareholders may be getting a break soon thanks to a classic bottoming pattern that's been forming in shares since last fall.
JCP is currently forming an inverse head and shoulders pattern, a technical setup that indicates exhaustion among sellers. The pattern is formed by two swing lows that bottom out around the same level (the shoulders), separated by a bigger trough called the head; the buy signal comes on the breakout above the pattern's "neckline" level, currently right at $10 resistance. The long-term setup stage of this price pattern comes with equally long-term upside implications when the breakout happens.
Lest you think that the inverse head and shoulders is too well known to be worth trading, the research suggests otherwise: a recent academic study conducted by the Federal Reserve Board of New York found that the results of 10,000 computer-simulated head-and-shoulders trades resulted in "profits [that] would have been both statistically and economically significant."
That's good reason to keep a close eye on JCP this week.
To see this week's trades in action, check out the Technical Setups for the Week portfolio on Stockpickr.
-- Written by Jonas Elmerraji in Baltimore.
RELATED LINKS:
>>5 Hated Earnings Stocks You Should Love
>>4 Big Stocks on Traders' Radars
>>5 Stocks Under $10 Set to Soar Higher
Follow Stockpickr on Twitter and become a fan on Facebook.
At the time of publication, author had no positions in stocks mentioned.
Jonas Elmerraji, CMT, is a senior market analyst at Agora Financial in Baltimore and a contributor to
TheStreet. Before that, he managed a portfolio of stocks for an investment advisory returned 15% in 2008. He has been featured in Forbes , Investor's Business Daily, and on CNBC.com. Jonas holds a degree in financial economics from UMBC and the Chartered Market Technician designation.Follow Jonas on Twitter @JonasElmerraji
No comments:
Post a Comment